The description comes back in a header
Every successful render carries x-chartrelay-alt: a sentence built from the data. Read it once, paste it into the alt attribute, and the chart is still readable when the image is not.
One URL returns the image itself. If a tool accepts an image URL — an HTML email, a README, a Notion page, a Slack message, a spreadsheet cell, an automation step — it already accepts a ChartRelay chart. There is nothing to install and nothing to sign up for.
No account and no key. Renders through this endpoint are unlimited, unmetered, and never count against a plan's monthly quota. Free charts carry a small chartrelay.dev mark; a Pro or Scale key removes it.
There is no upload, no id to keep and no second request. The numbers, the labels and the title all travel in the querystring, and the answer is a PNG. Change a number in the URL and you have a different chart.
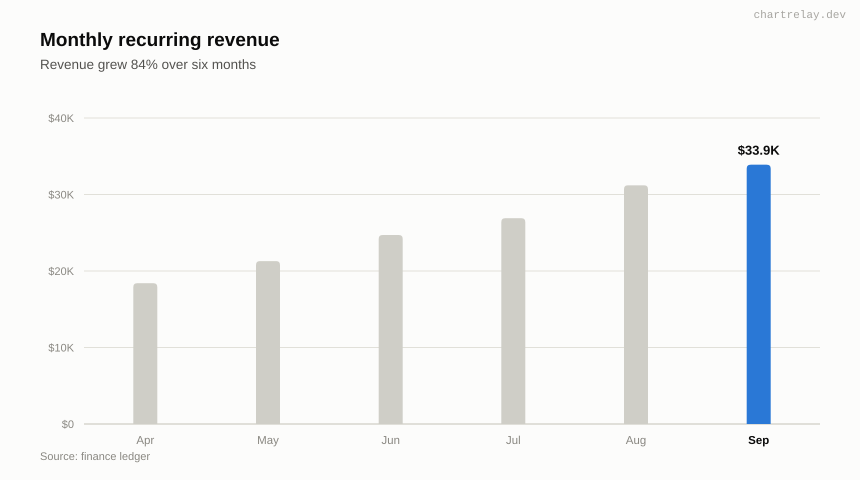
https://chartrelay.dev/chart?data=18400,21300,24700,26900,31200,33900&labels=Apr,May,Jun,Jul,Aug,Sep&names=MRR&title=Monthly+recurring+revenue&subtitle=Revenue+grew+84%25+over+six+months&prefix=$&source=Source:+finance+ledgerEvery parameter here is documented with its default and its limits in the URL reference. format=svg returns SVG instead of PNG; style=classic asks for the older drawing.
Every successful render carries x-chartrelay-alt: a sentence built from the data. Read it once, paste it into the alt attribute, and the chart is still readable when the image is not.
A mistyped parameter comes back as a small card saying what was wrong, with a 4xx status. An <img> tag cannot show a JSON body, so the reason is drawn instead of hidden behind a broken-image icon.
A successful chart is served immutable with a one-year age. Mail clients and chat apps fetch through image proxies that would otherwise re-render the same chart for every recipient.
Past that the request is refused, because long URLs are truncated at different undocumented lengths by browsers, proxies and mail clients. For a bigger chart, post it to the JSON API and paste the short URL it returns.
An abuse ceiling rather than a quota. Renders stay unlimited; anything drawn twice should be coming from a cache. Over the ceiling you get a 429 with a retry-after.
This endpoint draws what you ask for. The structural review that can refuse a chart lives on the JSON API and in the free chart checker.
The case the endpoint exists for. No mail client runs your JavaScript, and most will not render an SVG either, so a PNG behind an <img> tag is the only thing that works everywhere.
<!-- The editorial canvas is a fixed 860x480, so these numbers match it exactly. -->
<img
  src="https://chartrelay.dev/chart?data=18400,21300,24700,26900,31200,33900&labels=Apr,May,Jun,Jul,Aug,Sep&names=MRR&title=Monthly+recurring+revenue&subtitle=Revenue+grew+84%25+over+six+months&prefix=$&source=Source:+finance+ledger"
  alt="Monthly recurring revenue. MRR peaks at 33,900 for Sep and bottoms at 18,400 for Apr. It increased 84.2% from first to last point."
  width="860"
  height="480"
  style="max-width:100%;height:auto;display:block;border:0"
>
PNG is the default, so there is nothing to ask for. The fixed 860x480 is the editorial canvas; in the classic style the size is whatever w and h you sent, and defaults to 900x520. If your templating layer is strict about markup, write each & between parameters as & — it is the same URL once the client has parsed the attribute.
# HEAD is answered without drawing anything, so it carries no alt text.
# Send a GET, keep the headers, throw the image away.
curl -sS -D - -o /dev/null "https://chartrelay.dev/chart?data=18400,21300,24700,26900,31200,33900&labels=Apr,May,Jun,Jul,Aug,Sep&names=MRR&title=Monthly+recurring+revenue&subtitle=Revenue+grew+84%25+over+six+months&prefix=$&source=Source:+finance+ledger" | grep -i '^x-chartrelay'

x-chartrelay-alt: Monthly recurring revenue. MRR peaks at 33,900 for Sep and bottoms at 18,400 for Apr. It increased 84.2% from first to last point.
x-chartrelay-style: editorial
The alt text is identical whichever renderer drew the chart, so switching style never changes what you tell a screen reader. x-chartrelay-note joins these headers when the drawing is not the one you asked for.
Ordinary image syntax. The alt text goes in the square brackets, which is the part most generated READMEs leave empty.
<!-- Two series, as SVG, for a README that renders inline SVG: -->
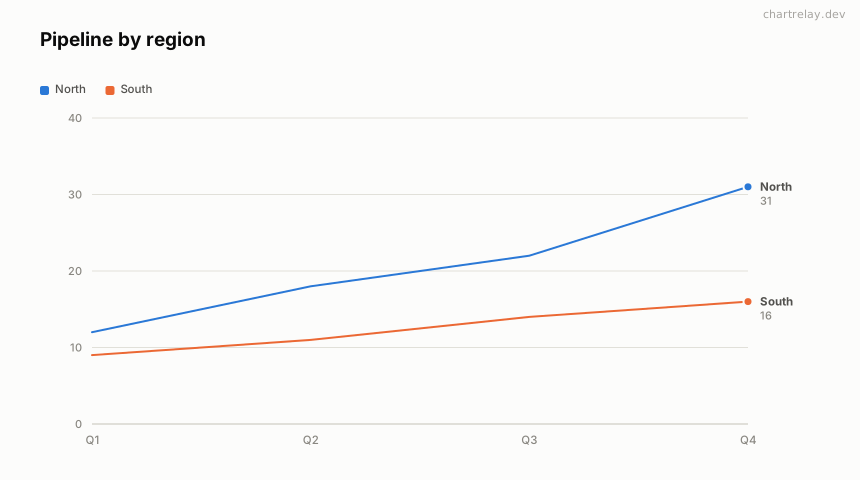Write a space as + and a series separator as %7C: a bare | is not a legal URL character and some Markdown renderers will cut the link at it. Both decode to the same thing before the chart is read.
Notion has no ChartRelay integration, and does not need one: an image block that points at a URL is enough.
Start from the example above, or open the playground, get the chart right, and copy the query out of it.
Type /image on a new line, choose the option that takes a link rather than an upload, and paste the URL.
PNG is the default and is the safe choice inside a document you will export to PDF later.
Notion's caption is visible to everyone, not only to screen readers, so the sentence from x-chartrelay-alt earns its place there.
Two ways in, depending on whether a person or a program is posting.
Put the URL on a line of its own in the message. Slack fetches image URLs and shows the picture under the message.
Use a Block Kit image block, below. It takes an alt_text field — fill it from x-chartrelay-alt rather than repeating the title.
{
  "blocks": [{
    "type": "image",
    "image_url": "https://chartrelay.dev/chart?data=18400,21300,24700,26900,31200,33900&labels=Apr,May,Jun,Jul,Aug,Sep&names=MRR&title=Monthly+recurring+revenue&subtitle=Revenue+grew+84%25+over+six+months&prefix=$&source=Source:+finance+ledger",
    "alt_text": "Monthly recurring revenue. MRR peaks at 33,900 for Sep and bottoms at 18,400 for Apr. It increased 84.2% from first to last point."
  }]
}
Keep the default PNG here. Slack fetches the image through its own proxy, which is exactly the case the one-year immutable cache header is for.
IMAGE() takes a URL and draws the result in the cell, which turns a row of numbers into a chart without leaving the sheet.
=IMAGE("https://chartrelay.dev/chart?data=18400,21300,24700,26900,31200,33900&labels=Apr,May,Jun,Jul,Aug,Sep&names=MRR&title=Monthly+recurring+revenue&subtitle=Revenue+grew+84%25+over+six+months&prefix=$&source=Source:+finance+ledger")

Built from cells instead of typed out — row 1 holds the labels, row 2 the numbers:

=IMAGE("https://chartrelay.dev/chart?title=" & ENCODEURL(A2)
  & "&labels=" & ENCODEURL(TEXTJOIN(",", TRUE, B1:G1))
  & "&data=" & TEXTJOIN(",", TRUE, B2:G2))
Leave format at its default: IMAGE() wants a raster image, not SVG. ENCODEURL() matters on anything a person typed — a stray & or # in a title otherwise ends the parameter early.
These recipes are string concatenation, not an integration. That is the honest description, and it is also why they work in any tool that can build a URL.
Concatenate the origin, /chart?, and your parameters, interpolating fields from earlier steps. Most tools do this inline in the next step's input; a formatter step is only needed when you want to reuse the string.
If the destination takes an image URL — a Slack message, an email body, a Notion block — paste the built URL straight into that field and stop. The HTTP step is only for when you need the image file itself.
Point Webhooks by Zapier at the URL with a GET, or use Make's HTTP › Make a request module, and hand the response on as a file attachment.
A 4xx still returns a picture, so a step that only checks "did I get an image?" will pass a chart that failed. Check the status code, or read x-chartrelay-error, which carries the same sentence the picture shows.
https://chartrelay.dev/chart?title={{title}}&labels={{labels}}&data={{values}}&prefix=$

Percent-encode anything that can contain a space or punctuation before you
concatenate it. A space may also be written as +, which is what the examples
on this page use.
The placeholder syntax belongs to your tool, not to ChartRelay. Everything after ? is documented in the URL reference.
None of these is a surprise if you read them now. All of them are a surprise in someone else's inbox.
Anything that can see the URL can see the key parameter: mail relays, image proxies, CDN and server logs, anyone who forwards the message. Use it where the URL stays inside systems you control, and treat a key that has been in a public URL as disclosed.
There is no authentication on this endpoint, so anyone holding the URL can draw the chart. Do not put numbers in one that you would not put on a public page.
The editorial renderer draws bar and line today. Ask it for a pie, an area or a scatter and you get the classic drawing instead, with x-chartrelay-note saying so. A multi-series bar is drawn as lines, and says so the same way.
Free charts carry a small chartrelay.dev mark in the top-right corner. A key from a Pro or Scale workspace removes it; a key that is missing, unrecognised or on a free workspace is not an error, the chart simply keeps the mark.
No. GET /chart is unauthenticated and unmetered, and a render through it never counts against a plan's monthly quota. An account is only worth having if you want the chartrelay.dev mark gone or you want the JSON API.
On renders, no — that is the deliberate trade, because a monthly cap makes a buyer estimate their usage before they have used anything. There is a 240-requests-a-minute ceiling per IP address to stop one client hammering an uncached URL, and an 8 KB limit on the querystring.
That is the error. An <img> tag cannot show a JSON body, so a refusal is drawn as the image and names the parameter that was wrong. The status is 4xx and x-chartrelay-error carries the same sentence.
In the classic style, yes: w and h take 320–2400 and 240–1600. The editorial style draws on a fixed 860x480 canvas that its type sizes and spacing are tuned to, and accepts w and h without using them. Scale the image in the page instead, or send style=classic.
Bar, line, area, pie and scatter — the same five the JSON API takes. Bar and line are drawn in the editorial style; the other three fall back to the classic renderer and say so in x-chartrelay-note.
Past 8 KB of querystring the request is refused rather than half-drawn, because long URLs are truncated at different undocumented lengths by browsers, proxies and mail clients. Post the chart to /api/v1/charts instead and use the short asset URL it hands back — that is what the refusal tells you to do.
Not here. This endpoint draws what you ask for; the structural review that refuses a chart outright belongs to the JSON API. Paste a chart into the free chart checker first if you want the findings.
The URL is the chart — the same query can only ever produce the same image, which is why it is served with a one-year immutable cache header. Nothing is stored on our side for it to expire.
No signup, nothing to install. Change a number in the query and fetch it again.
Free charts carry a small chartrelay.dev mark. Removing it is what a paid plan buys; renders are unlimited either way.